This article is currently an experimental machine translation and may contain errors. If anything is unclear, please refer to the original Chinese version. I am continuously working to improve the translation.
Background
My HomeLab PVE host has long been running a chaotic mix of workloads — from simple SMB/Syncthing file sharing, various scrapers and databases, to Windows/Linux VMs for development.
Although I’ve already configured proper internal firewall rules in the PVE console, I still notice unexplained and hard-to-trace internet traffic in Netdata monitoring. I’ve used tcpdump to investigate some of it, but it’s time-consuming and tedious.
So I decided to set up enterprise-grade traffic monitoring and analysis capabilities — something that can listen to all internal network traffic, perform DPI (Deep Packet Inspection) to understand application-level protocols, log events, and provide a dashboard for inspection.
An IDS (Intrusion Detection System) is a common feature in such network analysis tools. It automatically flags suspicious traffic based on rules, helping detect misconfigurations or signs of malicious intrusion.
At first, I tried some truly late-night enterprise-grade products, like FortiGate and Sophos free trial VMs. But the experience wasn’t satisfying — their configurations were complex and obscure, and event logging/viewing wasn’t clear enough.
Eventually, I settled on the open-source Suricata paired with the frontend Evebox. While Evebox’s UI is a bit barebones, it basically meets my needs and has very low CPU and memory usage.
Installation
LXC Container and Port Mirroring
Create a Debian 12 LXC container on PVE, name it suricata for example. First, add a normal network interface eth0 attached to vmbr0, and assign it an IP address for regular access to the container.
In the PVE Dashboard, go to Node - System - Network, and create a Linux bridge vmbr1. This bridge will be used solely for traffic mirroring — don’t assign an IP address or gateway, and don’t bind any physical interface yet.
Run the following script on the PVE host to mirror all traffic from VMs, containers, and the host itself to the vmbr1 bridge:
1 |
|
The syntax of these tc (traffic control) commands is admittedly bizarre — take for instance tc filter add dev vmbr0 parent ffff: protocol all u32 match u8 0 0 action mirred egress mirror dev vmbr1. Not many commands have such long and cryptic parameter lists. Since I don’t fully understand it myself, I won’t go into detail. Interested readers can look up tc usage — this was the simplest method I found for port mirroring on Linux.
Back to the topic: the apply_tc_rules function mirrors bidirectional traffic from a given port to vmbr1, and apply_tc_to_fwpr_ports applies this rule to vmbr0 and all interfaces bridged to it.
After running the script, all traffic on vmbr0 gets copied to vmbr1. (Note: if new VMs or containers are added later, you’ll need to re-run the script or manually apply the rules to new interfaces.)
Now, add a second network interface eth1 to the suricata container, connected to vmbr1. No IP configuration is needed. This way, inside the container, you can listen to all host traffic via eth1. You can verify this with tcpdump.
Suricata
As mentioned earlier, Suricata is a high-performance, open-source network analysis and threat detection engine. We’ll run it inside the LXC container, listening on eth1.
The official Debian package is outdated, so follow the official guide to compile from source: https://docs.suricata.io/en/latest/install.html. Be sure to run make install-conf to generate default configuration files.
Set up the systemd service file /etc/systemd/system/suricata.service:
1 | [Unit] |
Modify the Suricata config file /usr/local/etc/suricata/suricata.yaml as needed:
1 | # (Configuration is long; refer to comments and adjust as needed. Only essential parts shown below) |
Before starting, use suricata-update to download the default set of detection rules provided by Suricata.
Then run systemctl daemon-reload and systemctl enable --now suricata to start the Suricata service. If everything goes smoothly, Suricata should now be running:
1 | # systemctl status suricata |
By default, Suricata writes events to eve.json under /usr/local/var/log/suricata/. This is a continuously growing JSON file, so you’ll need to set up logrotate yourself.
My /etc/logrotate.d/suricata config for reference:
1 | /usr/local/var/log/suricata/*.log /usr/local/var/log/suricata/*.json |
After setup, test rotation manually with logrotate -f /etc/logrotate.d/suricata.
Suricata installation is now complete. It offers many advanced features — see the official documentation: https://docs.suricata.io/en/latest/what-is-suricata.html
EveBox
EveBox is a frontend that consumes and processes Suricata events.
Download the binary from the official site and place it in /usr/local/bin/evebox.
Set up a systemd service /etc/systemd/system/evebox.service to run EveBox and consume Suricata events:
1 | [Unit] |
Create the config file /etc/evebox/config.yaml (full example available here):
1 | # EveBox Server configuration file. |
Start the service with systemd, and you can access the web interface directly. The JSON data from Suricata will be stored by EveBox in /var/lib/evebox/config.sqlite, automatically rotated based on the 7-day and 15 GB limits.
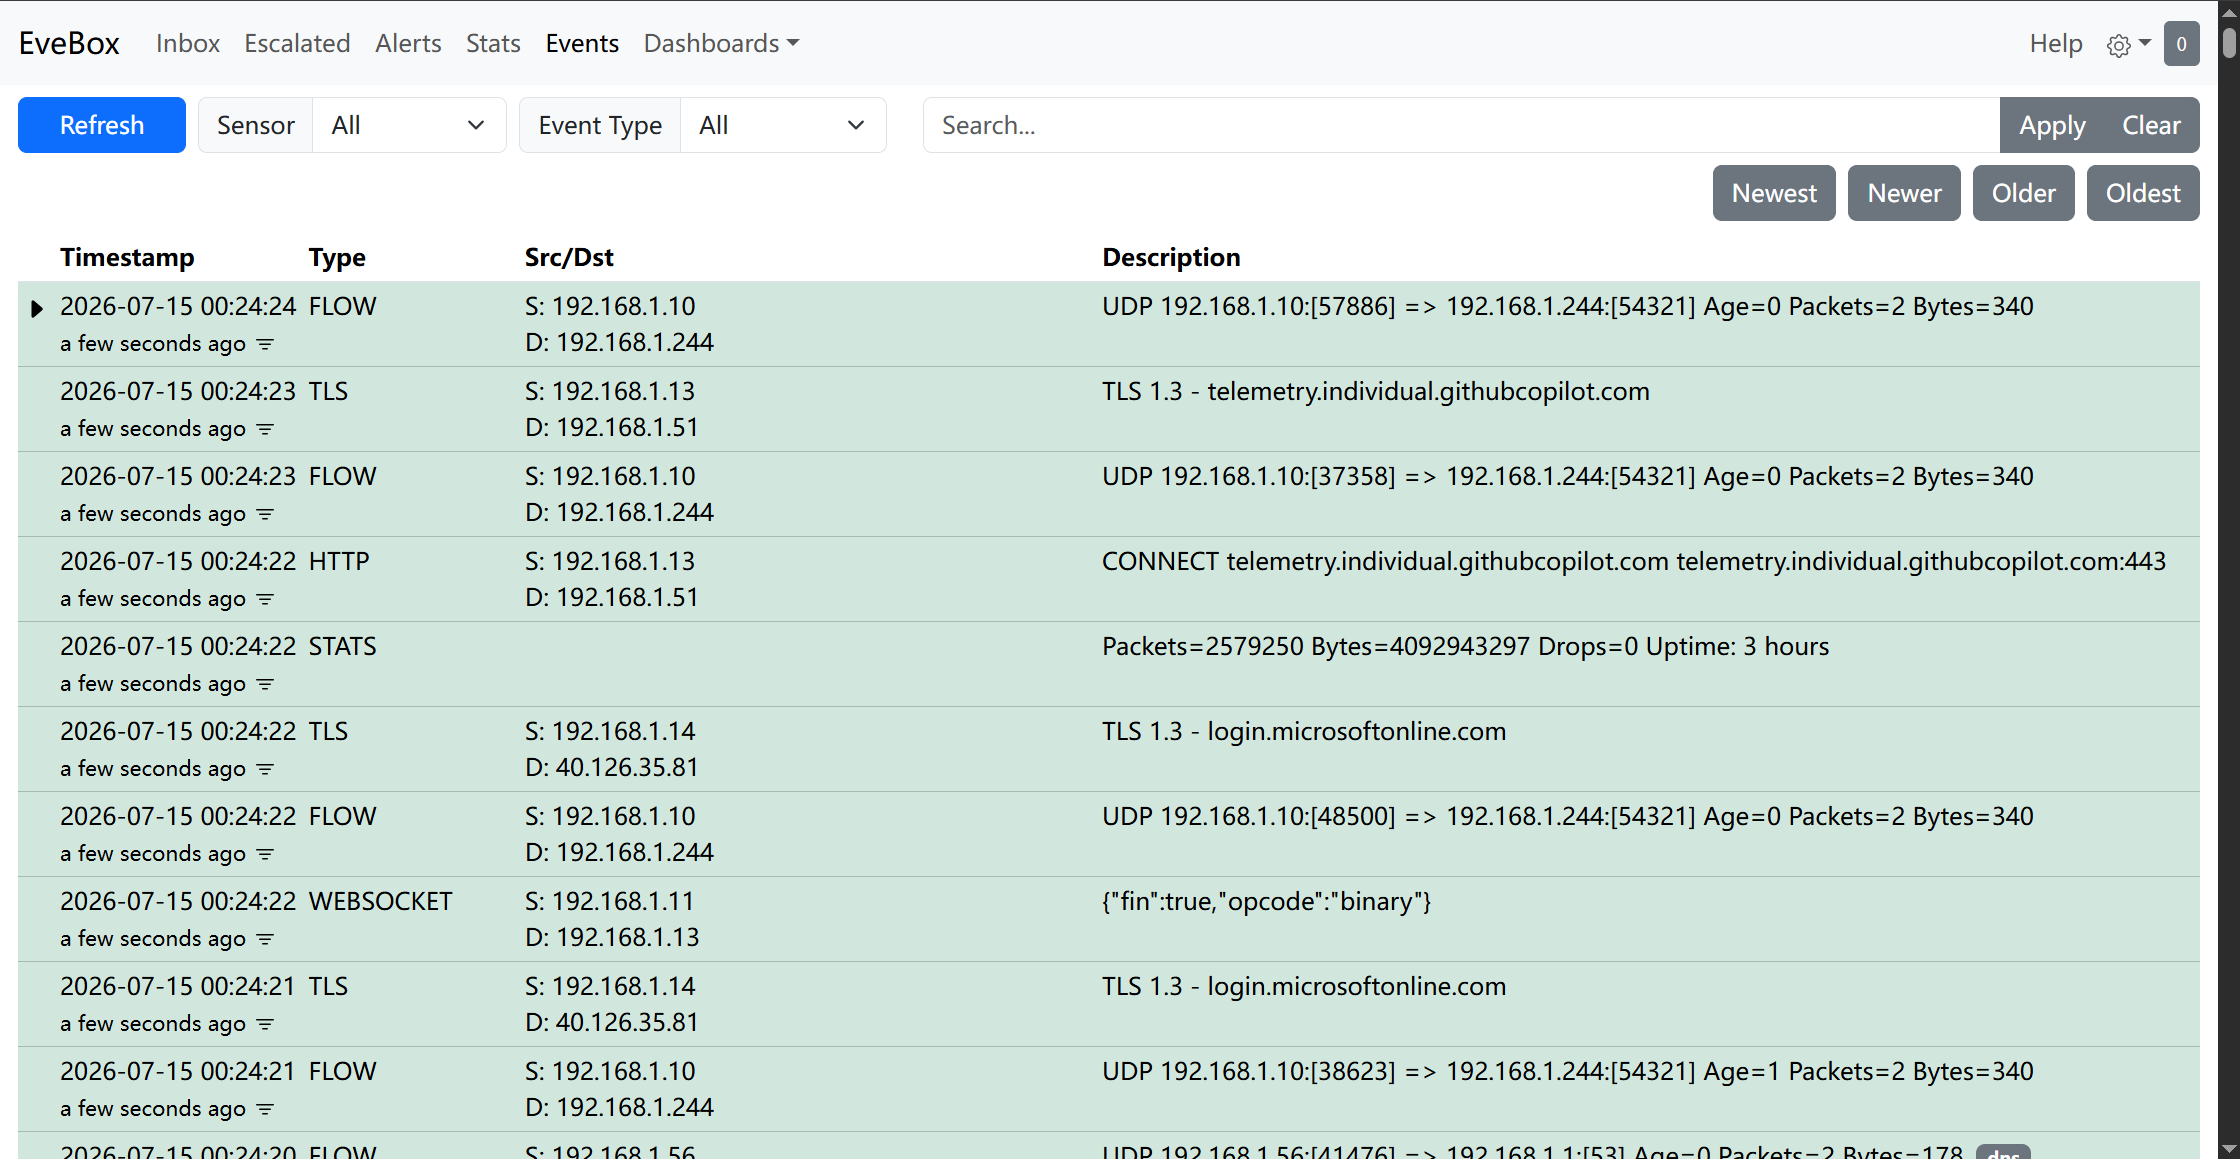 List of captured events
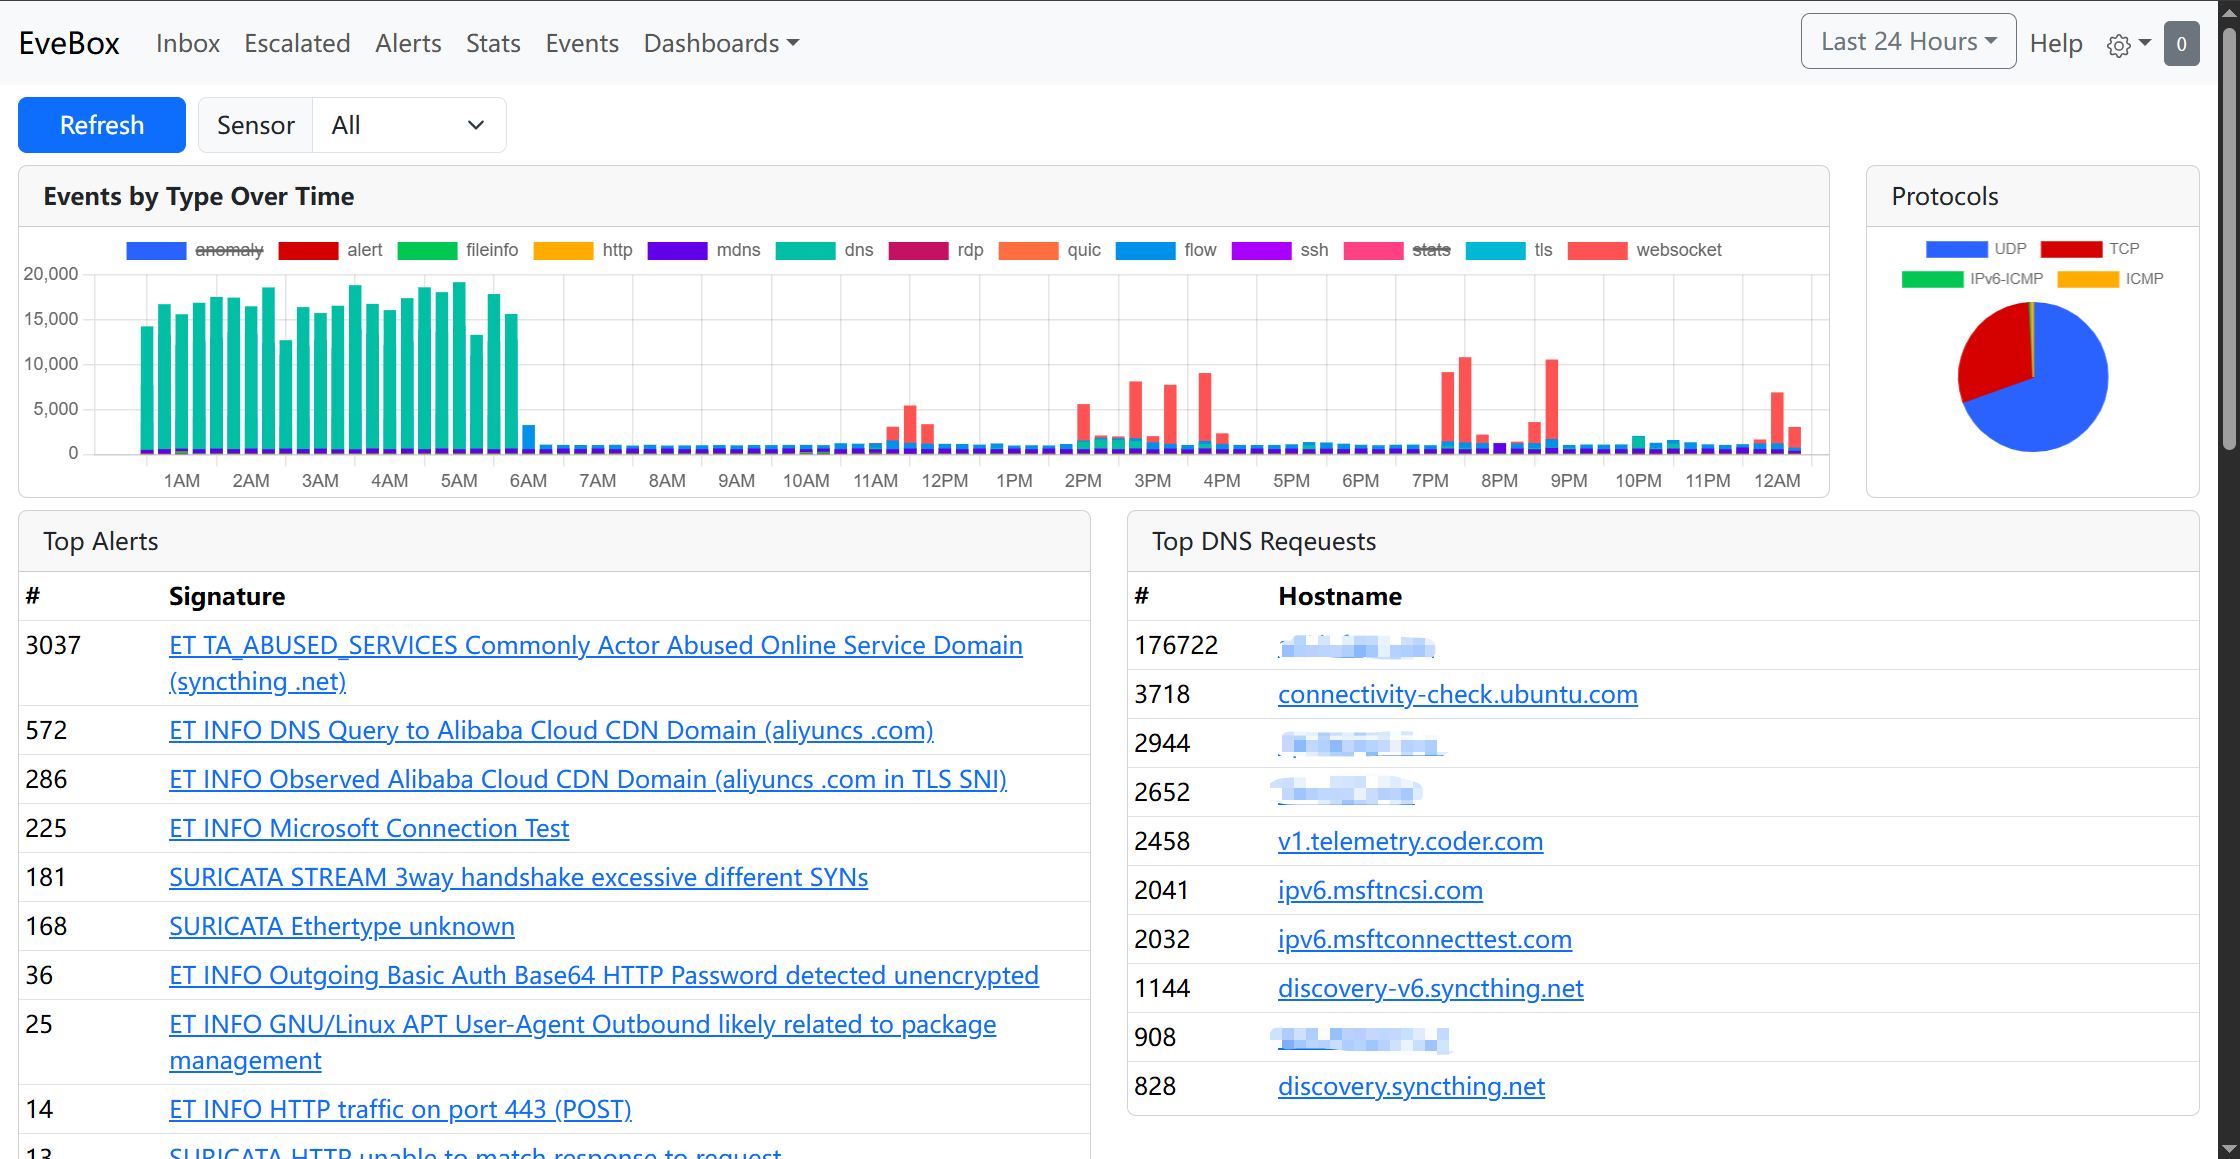 A monitoring dashboard
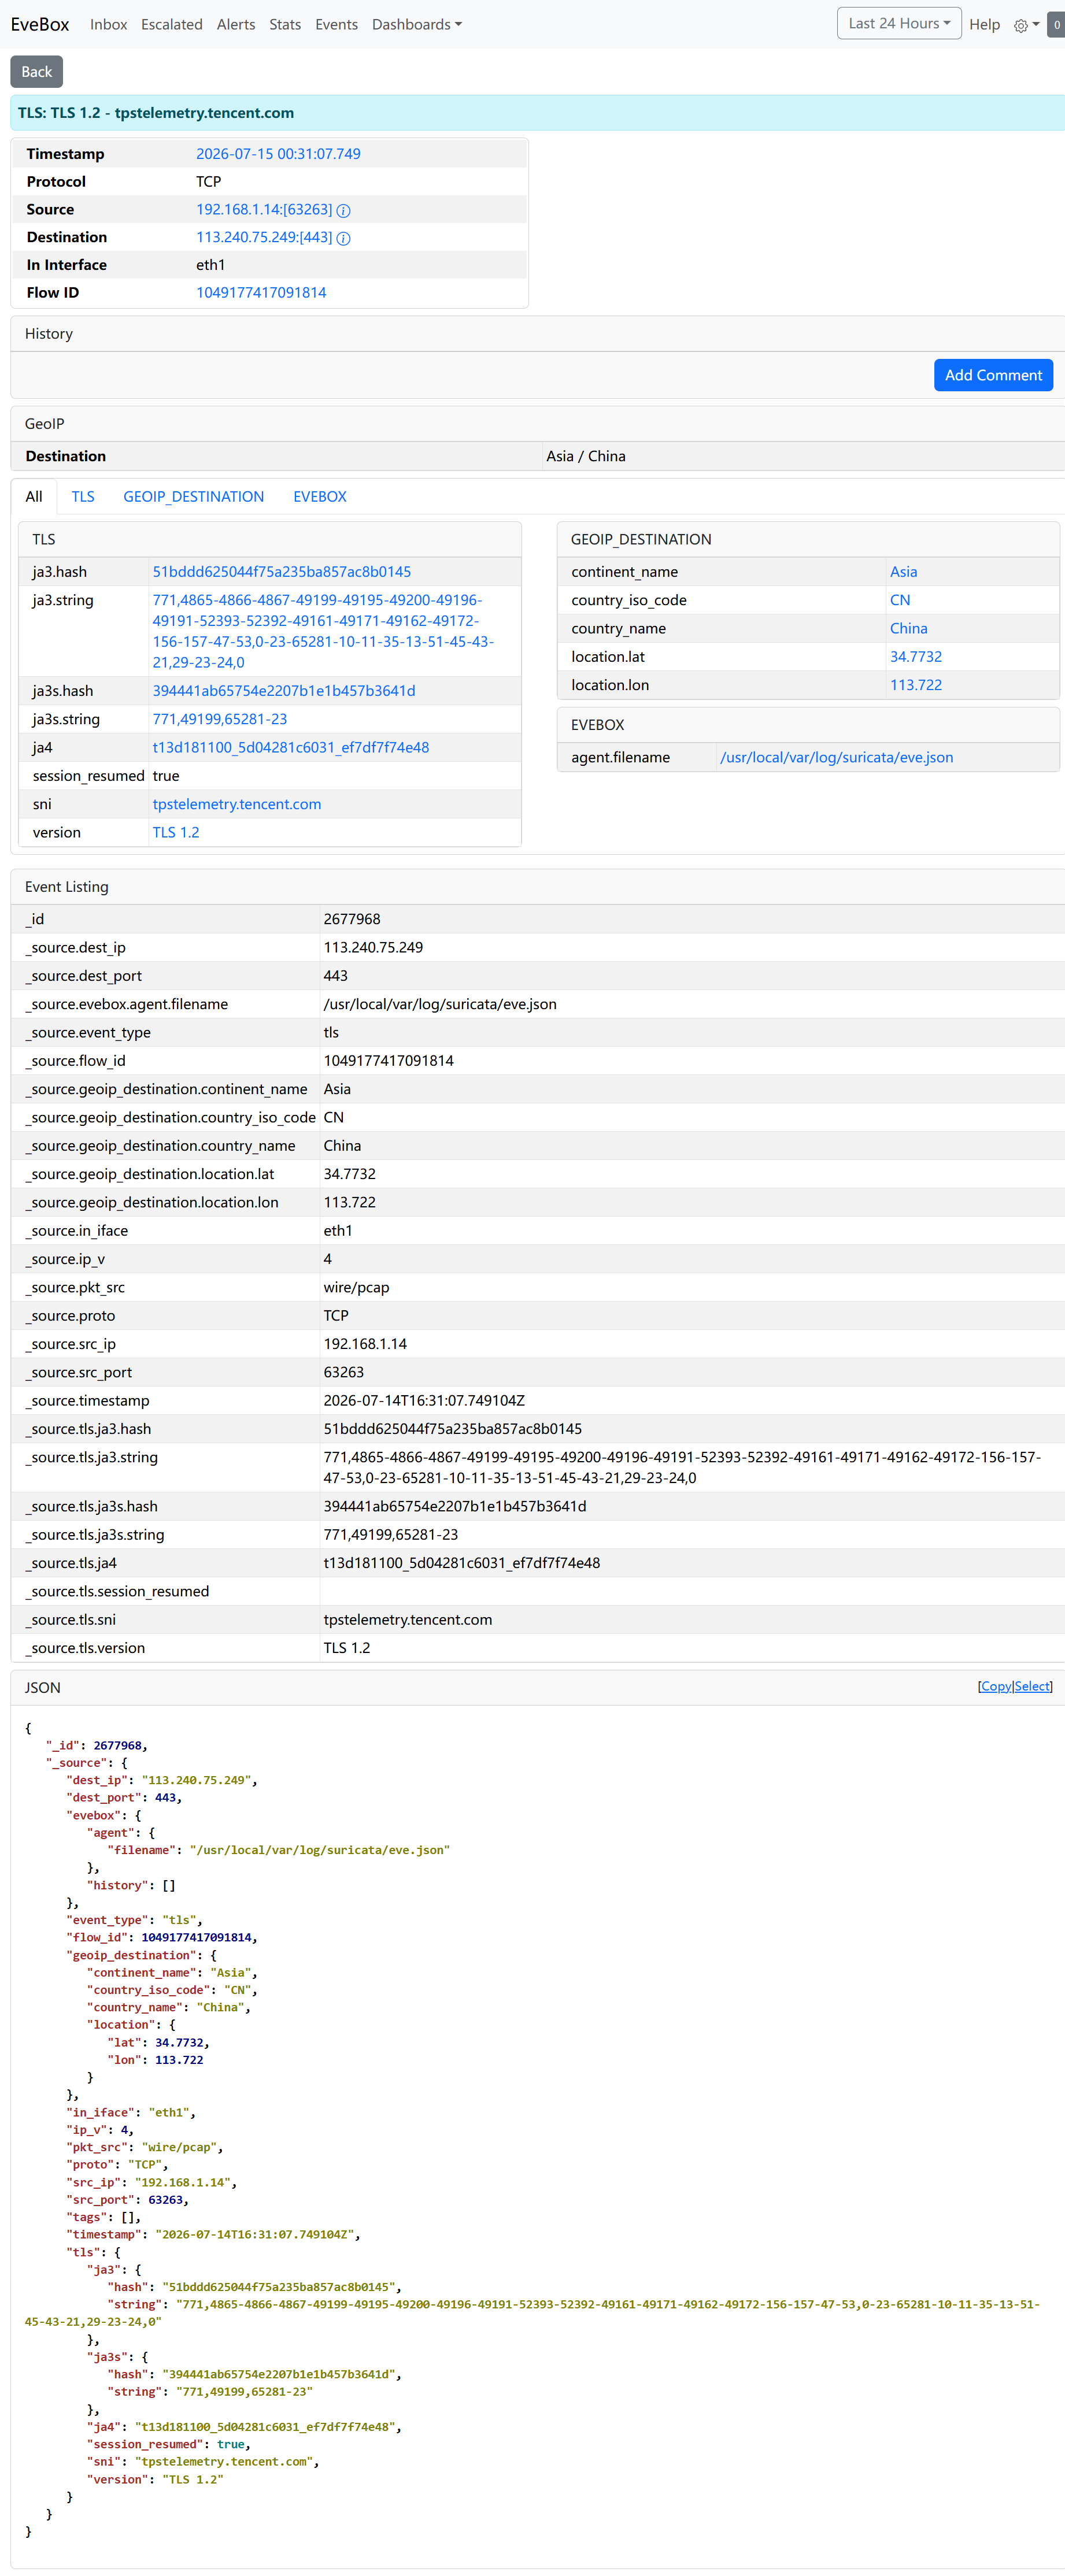 An example TLS event, with different fields identified for various traffic types
This article is licensed under the CC BY-NC-SA 4.0 license.
Author: lyc8503, Article link: https://blog.lyc8503.net/en/post/22-network-ids/
If this article was helpful or interesting to you, consider buy me a coffee¬_¬
Feel free to comment in English below o/